Graphs are great! They quickly show groups of nodes (or Notes in RamSync) and connections. Such visualizations are a powerful tool for learning and analytics. However, the more notes and connections in your graph, the more difficult it is to quickly spot the key insights from your graphs.
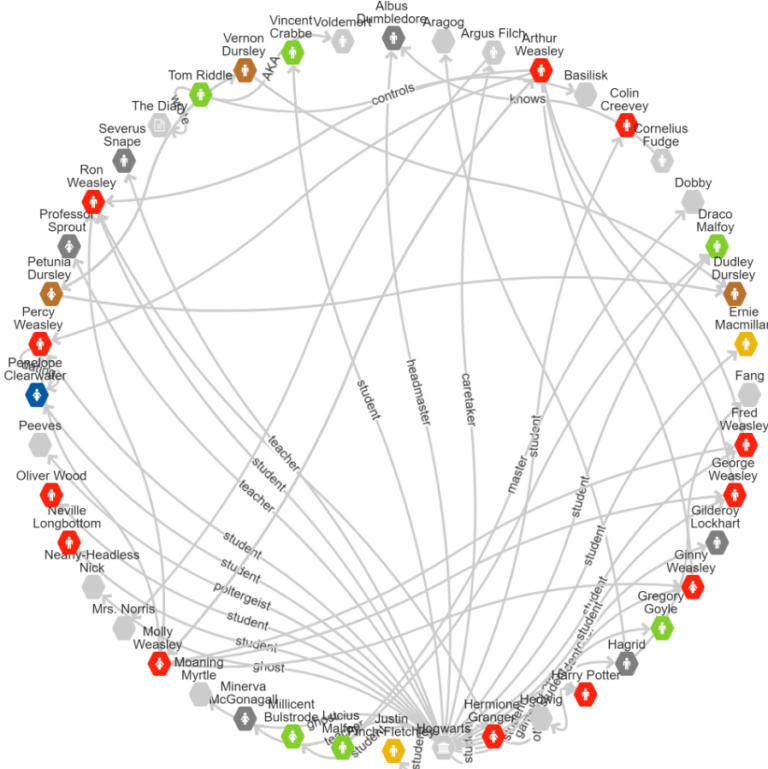
As graphs grow in size and complexity they can become incoherent, taking on the form of ‘hairballs’, ‘snowstorms’, or ‘starbursts’. The nodes and connections in these graphs are so dense, you cannot actually see the underlying patterns. Information gets lost in the noise and data density.
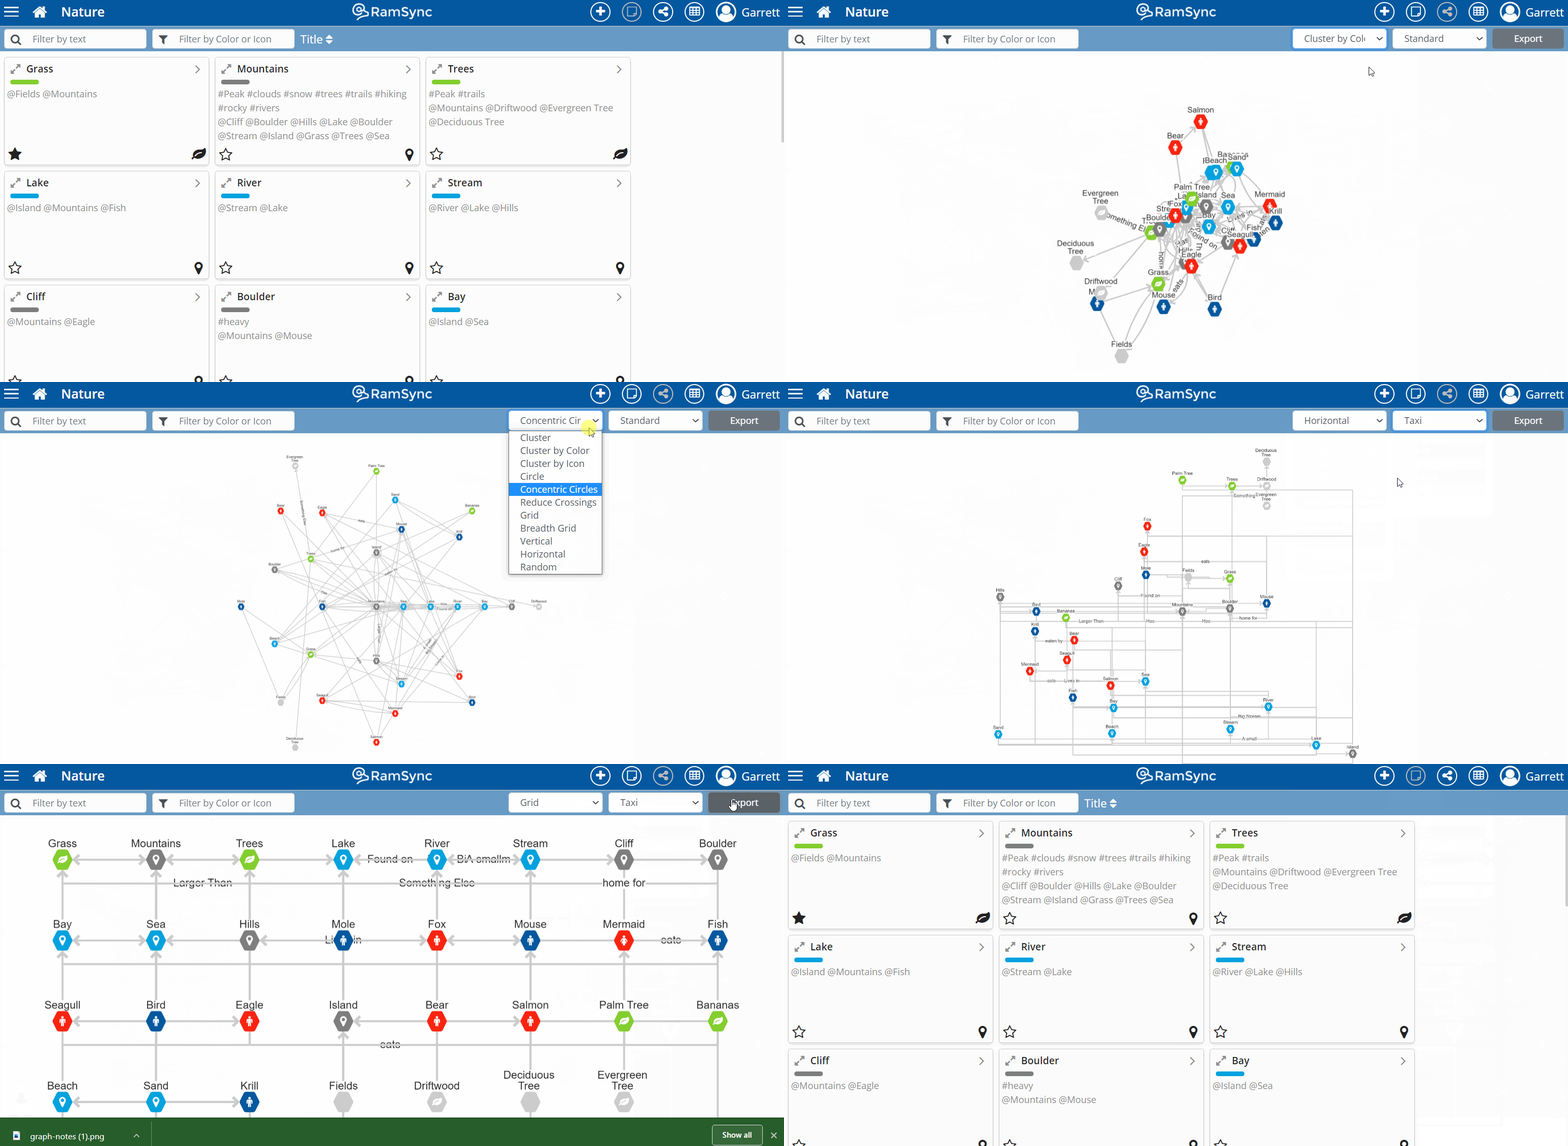
Layouts, colors, and icons are the first step in enhancing graphs. These visual tools help add categories and draw the eye to patterns. However, sometimes we need to take the analysis up a notch.
The image below is a graph of the internet in 2004. It is too large and complex to make sense of; a perfect example of a “hairball.” Visualized in one image, the internet is just too big to see clearly!
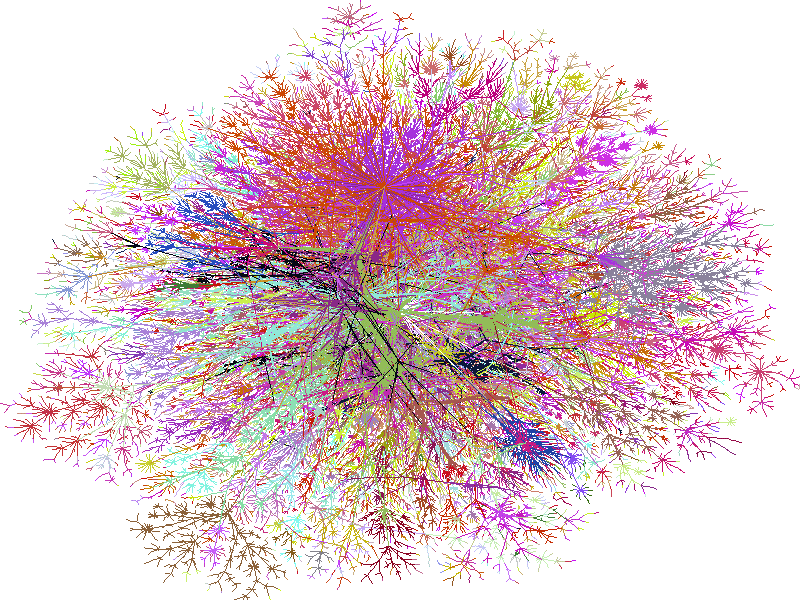
CC Image courtesy of Steve Jurvetson on Flickr
To make sense of the complexity, filtering to manageable subsets is key. In RamSync it is easy to narrow down onto tags, titles, colors, or icons. We can then focus our efforts down to the key areas of interest while still maintaining the structures and visuals for fast pattern recognition.
But sometimes filters and visuals are not enough. We must then turn to math and algorithms to reveal how our thoughts are connected. This is where the fun truly begins!
Math allows us to use graph traversal algorithms to unveil how Notes are connected.
Graph Traversal: What Is It?
Graph traversals are search algorithms that move across a graph by following the connections between notes. They are well defined mathematical processes and can take many forms depending on the application.
In RamSync, graph traversals highlight paths starting at any given node, following connections one note at a time.
The step-by-step process of connecting notes within a graph helps to visualize connections and proximity between pieces of information. Traversals are a powerful knowledge exploration tool, based in mathematics, and applied with computer science!
The Big Why
By showing how each Note is connected, and how the Note fits relative to other Notes, graph traversals can highlight existing connection flows, indicate missing connections, and call out unconnected clusters. These trails illuminate paths between known concepts and new ideas. Forming new connections is how we learn and often the start of creativity.
Two well-known traversal algorithms are breadth-first search (BFS) and depth-first search (DFS).
In traditional graph mathematics, BFS and DFS try to find a particular node or a path between two nodes in a graph. By animating the BFS and DFS, we focus on a starting node and then explores all paths from that particular starting location. We believe focusing on a single thought’s connections in a knowledge database is more illuminating than artificially trying to connect two thoughts, which we could just well. . . you know, connect.
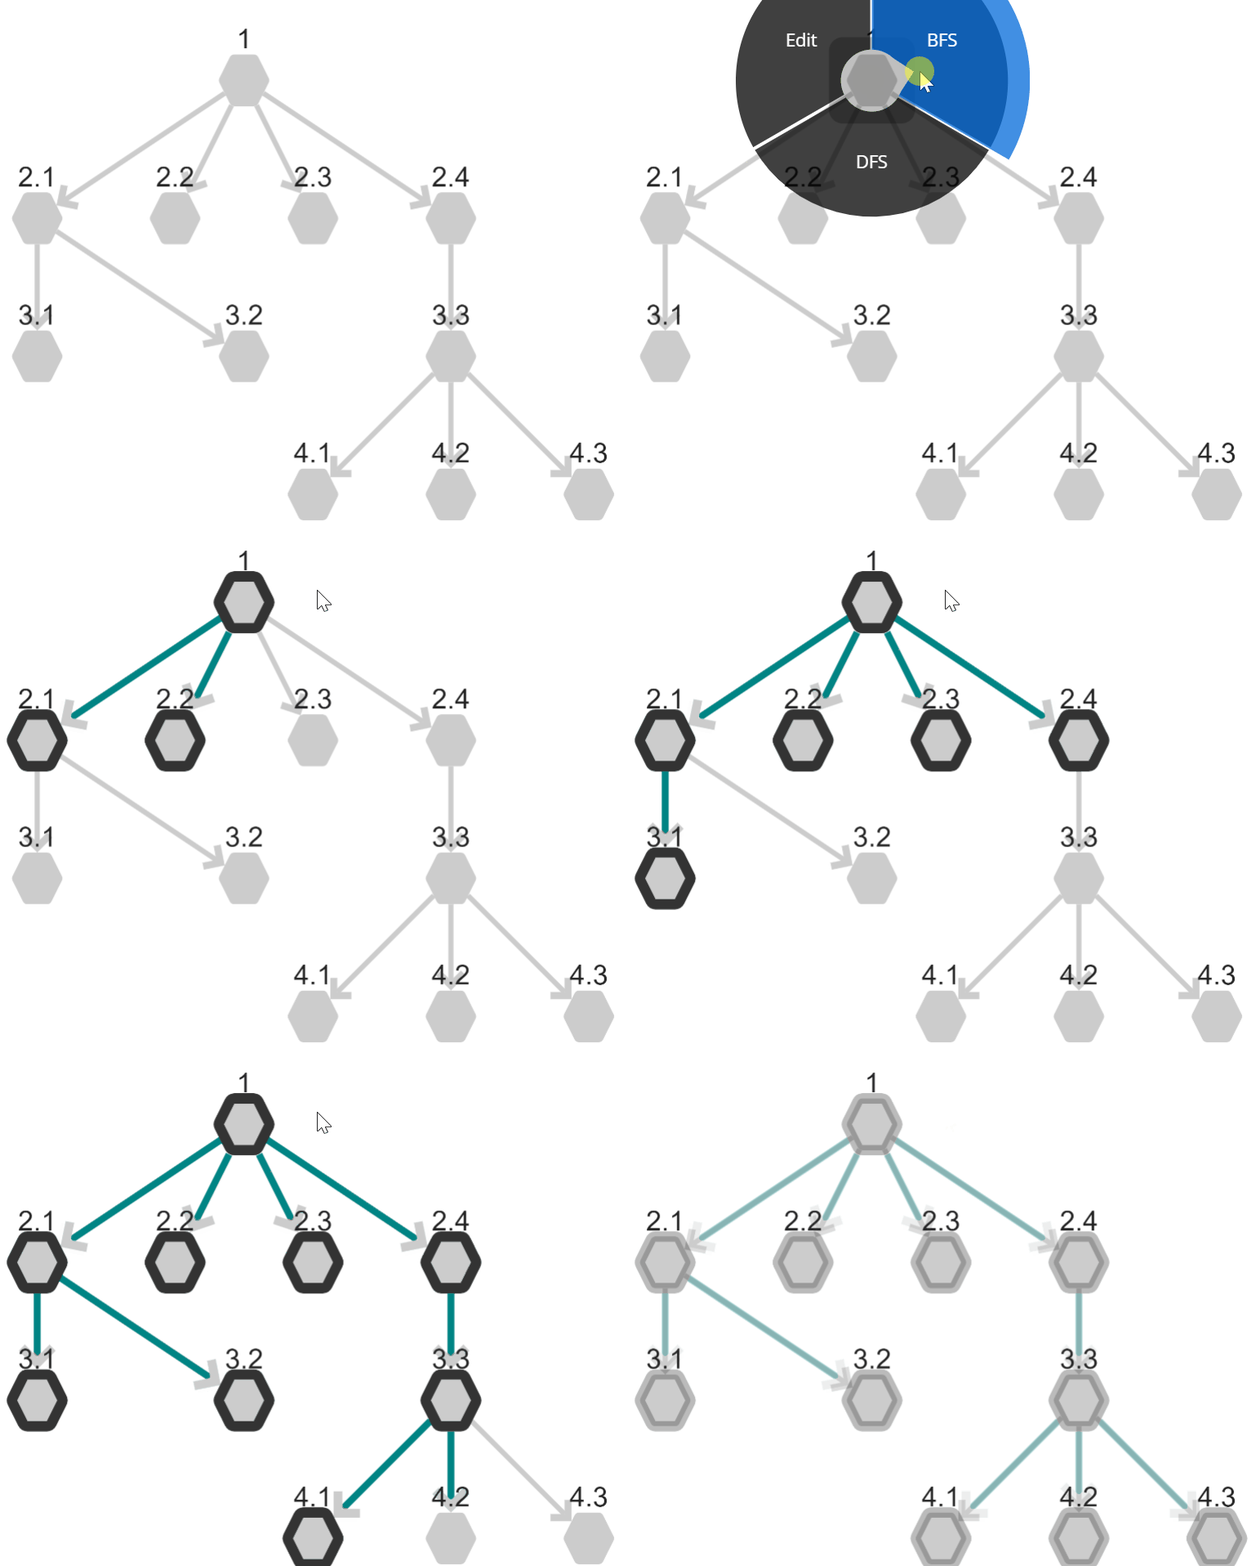
Breadth-First Search: BFS
Breadth-First Search starts at the selected node (Note!) and searches all of the neighboring nodes (one connection away).
Only once all nodes that are one connection away have been mapped does the algorithm begin tracing out nodes that are further away from the starting location.
This is similar to opening every link in a Wikipedia article, then going and opening every link in those articles, and so on. Opening all of the Wikipedia links on a page in this manner would rapidly open thousands of pages. Maybe you just want to Wikipedia Surf to see what you find along the way. There are over 6.2 million English Wikipedia articles to discover as you go. The idea is, at each stage you are opening all links from an article before moving on to the next article.
Depth-First Search: DFS
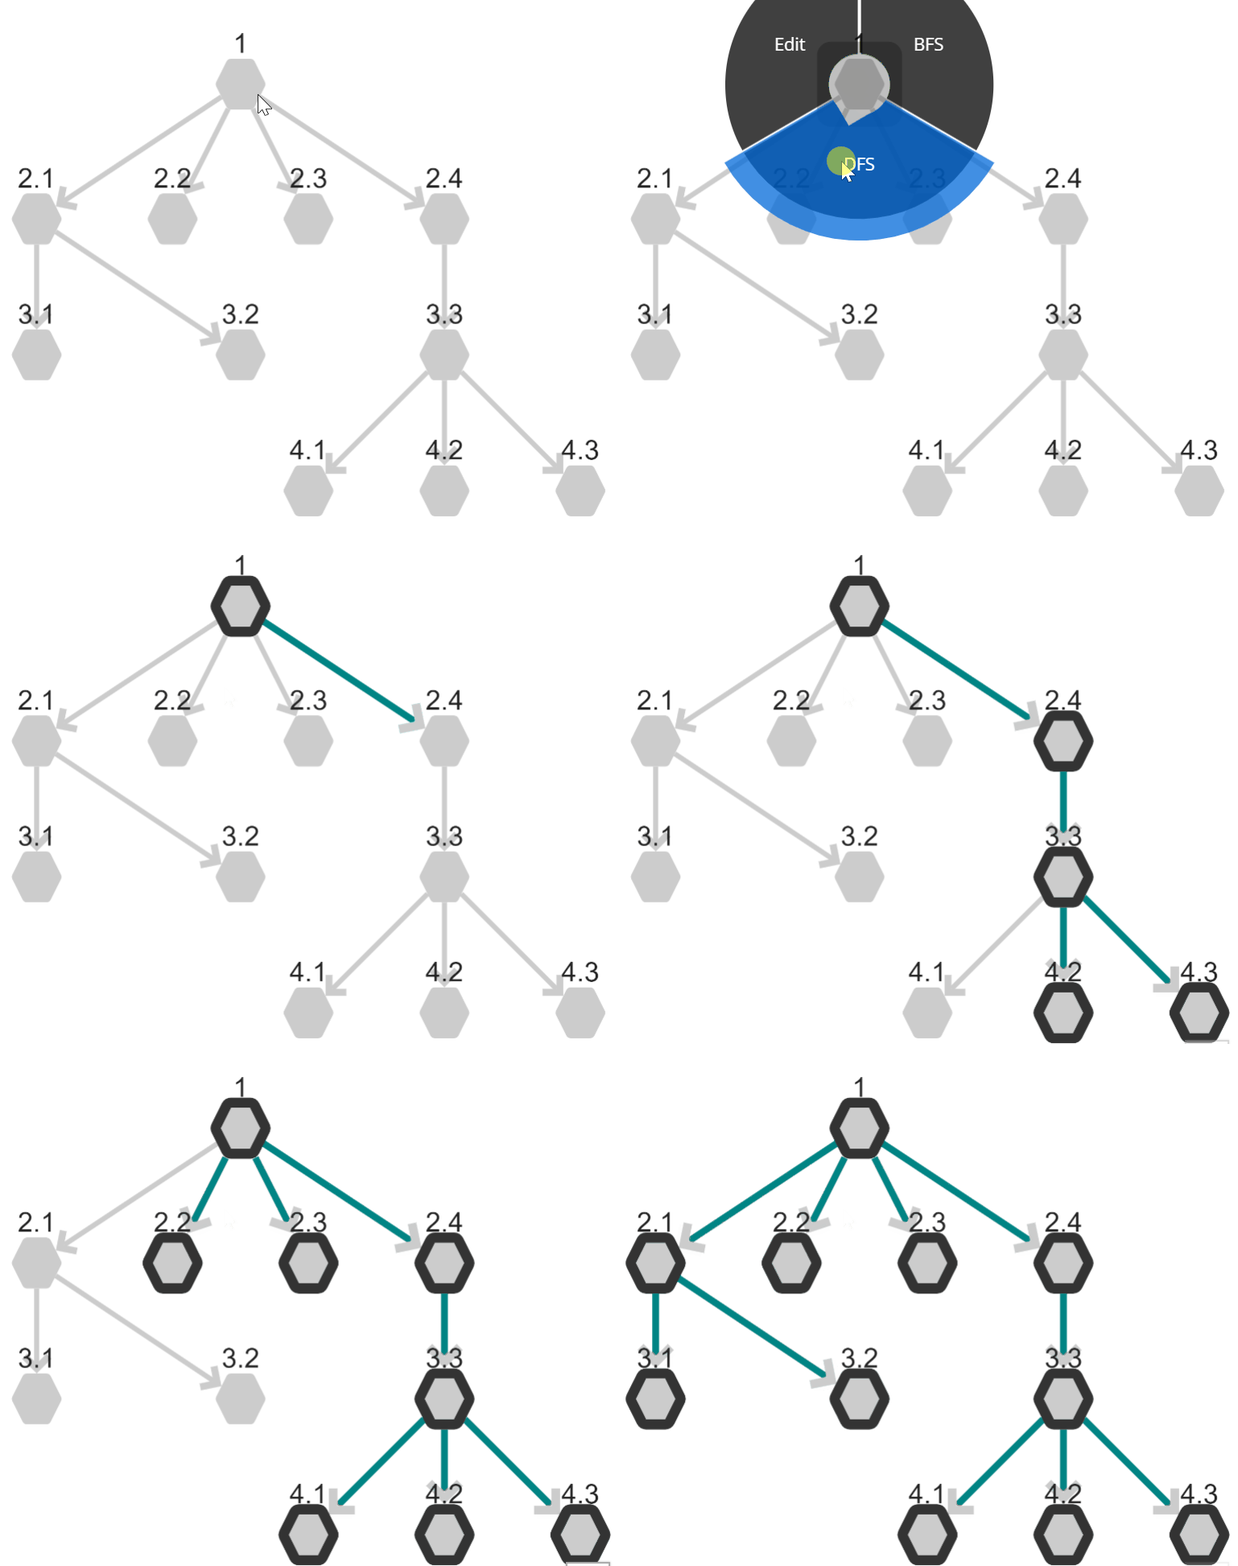
Depth-First Search uses the opposite strategy as Breadth-First Search.
This search follows the connections as deep as possible before returning to the start node and taking another path.
In our Wikipedia example, this is similar to opening the first link in an article, then the first link in that new article, and the first link in the next article, etc. For nearly all Wikipedia articles (~97%), this process will eventually lead to the Philosophy article. The idea here is that you will move on to the next article once you have explored the first link.
Uncovering Missing Connections
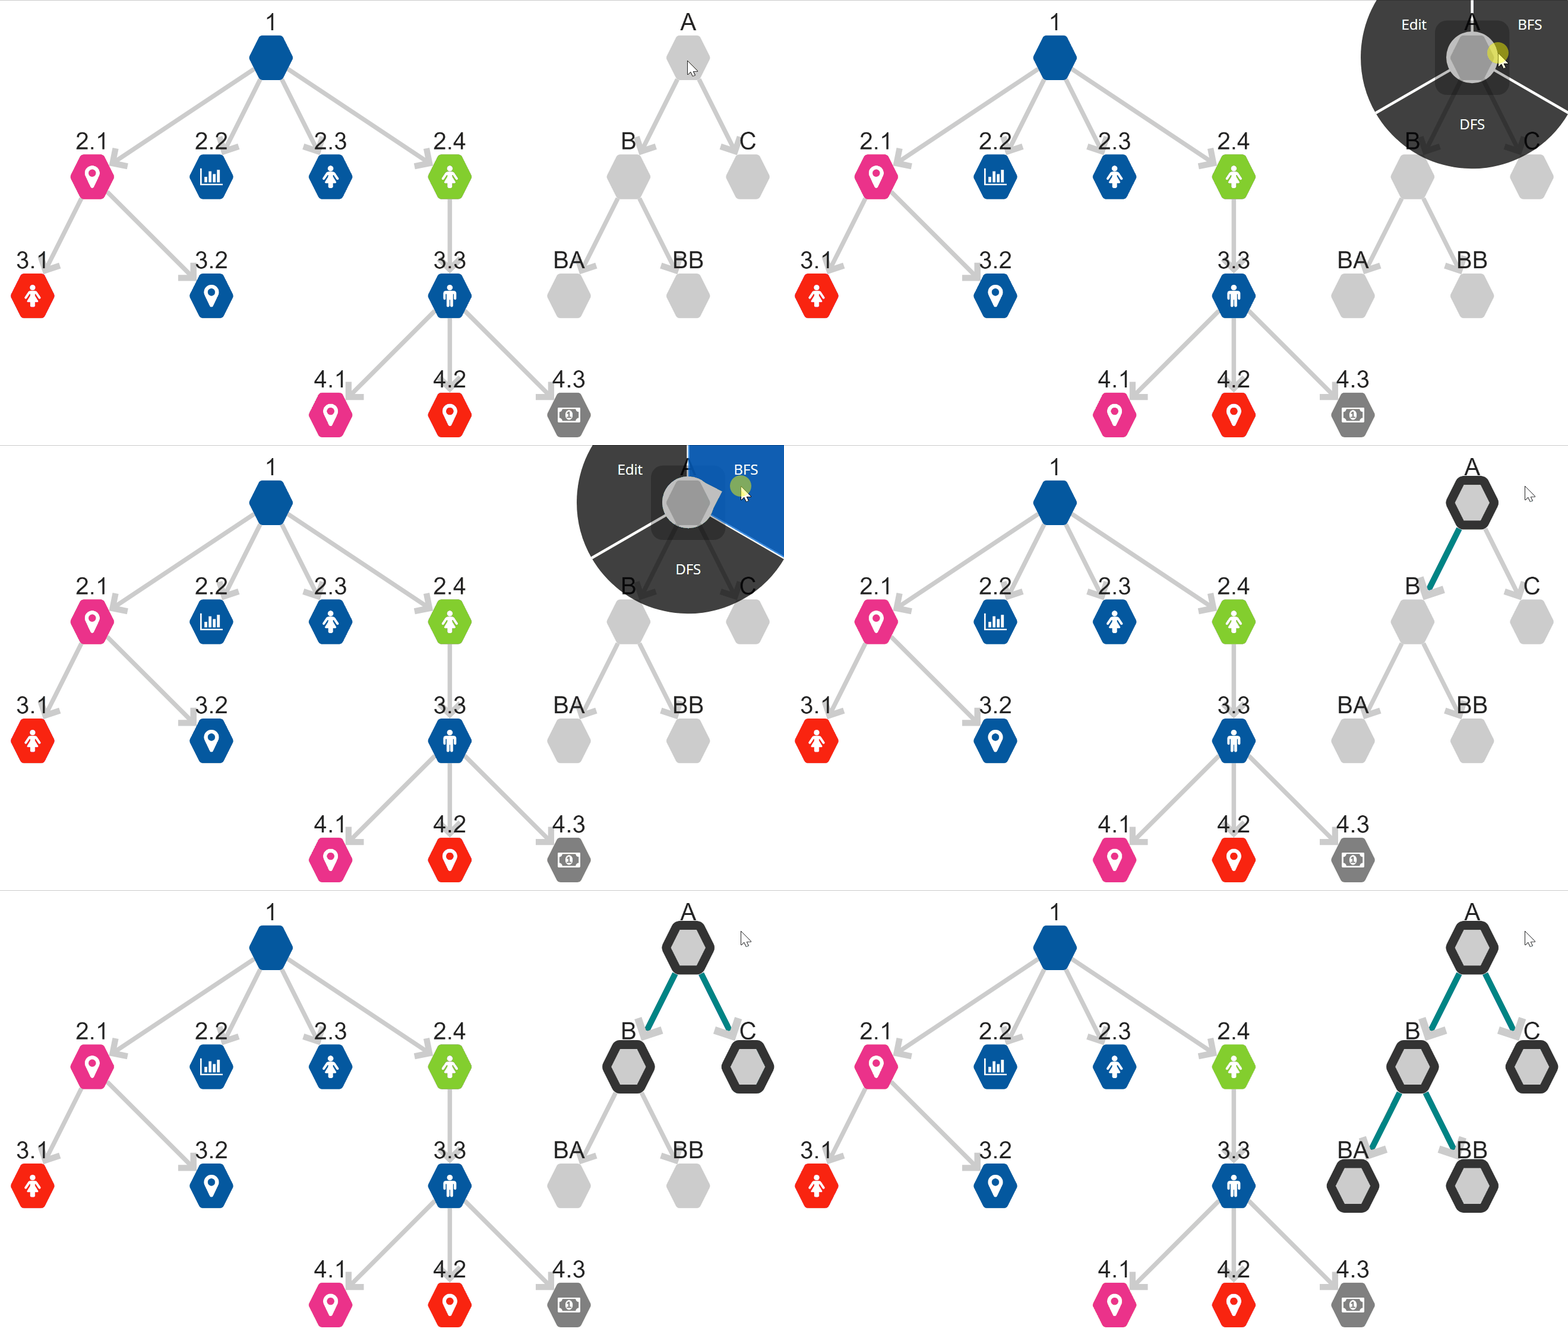
Either breadth-first search or depth-first search will only traverse connected components of a graph. If there is no connection path between two nodes, only one group of nodes in the graph will be highlighted. Here you can see a graph with numbered nodes and lettered nodes. There is no connection that bridges between the two sets of nodes. This means the algorithm will only ever search all of the numbered nodes or all of the lettered nodes.
So when would we use these search algorithms? Remember our discussion of the ‘hairball’ internet graph? Determining if a graph is connected or made up of separate components can get a little hairy in these larger graphs. This is when using either BFS or DFS could be useful.
For example, you might have all of your physics notes and all of your mathematics notes in one Study Collection. Surely, there should be some connection between these two (physics is just applied math, after all). Running a BFS or DFS could quickly identify any missing ‘applied’ connections between the two subject areas.
Conclusion
BFS and DFS are powerful tools in RamSync, giving easy access to advanced math! Take the exploration of your Mind Maps, Knowledge Graphs, and Zettelkasten to the next level with graph traversal algorithms. Sometimes it is best to let the computer do the thinking, so go ahead and give RamSync’s BFS and DFS searches a try!
How do you use graph traversals in your Collections? Are there any other algorithms you would like to see in RamSync? Drop us a note or comment below!
Take your notes to the next level and uncover more of what you already know. Create your free RamSync account!


